Organizational greenhouse gas inventory management module

Let every emission data have a source, so that the inspection results can withstand verification.

Completing a greenhouse gas inventory is not just about calculating a total amount of emissions, but more importantly, making each activity data, emission coefficient and supporting documents clearly traceable. When data are scattered across different departments and locations, organizers often spend a lot of time on expediting items, confirming versions, and rechecking numbers.

The organizational greenhouse gas inventory management module establishes a consistent reporting process based on organizational boundaries, locations and emission sources, and connects data collection, coefficient application, carbon emission calculation, supporting review and inventory output to help enterprises improve inventory efficiency and data credibility, and prepare for internal audits and external verifications.

Common management pain points in enterprises

Incomplete collection of cross-department materials, the organizer repeatedly urged the documents

Data on electricity, fuel, refrigerant and transportation are scattered in different departments and locations, and the filling format and time are inconsistent, making it difficult for the organizer to know in a timely manner who has not submitted it.

There are too many Excel versions and data modifications are difficult to track.

Forms are sent back and forth through email or communication software. It is easy for versions to be duplicated, formulas to be modified, or data to be overwritten. It is also difficult to confirm who filled in and updated the data.

The emission coefficient is continuously updated, and manual calculation is prone to errors.

Different versions of emission coefficients may apply in different years, emission types and calculation intervals. Manual search and application are not only time-consuming, but may also affect the inventory results due to coefficient or unit errors.

The evidence and data are stored separately, making it difficult to correspond during verification.

Electricity bills, invoices, meter reading records and equipment information are scattered in mailboxes or folders. When it comes to internal audits or external verifications, the corresponding relationships are found one by one and confirmed.

Managers cannot see the overall inventory progress and emissions

The reporting, auditing and emission results of each base are scattered in different files, making it difficult for managers to grasp the completion degree of inventory, main emission sources and abnormal data in a timely manner.

How does the module connect the greenhouse gas inventory process?

The module organizes organizational greenhouse gas inventory into eight steps:

  1. Organization and base setting

    Establish the company, operating base, inspection period and personnel authority, clearly define the inspection scope and work division.

  2. Emission source identification

    Establish an inventory of emission sources based on the equipment and operating activities of each location to complete the determination of scope and emission category.

  3. Activity data collection

    Each department fills in data such as electricity consumption, fuel consumption, and refrigerant replenishment amount according to the division of labor, and the module reminds unfinished projects.

  4. Automatic application of coefficients

    Based on the data type, calculation period and applicable specifications, the correct versions of emission coefficients and GWP are automatically introduced.

  5. Emission calculation

    Convert activity data and emission coefficients into carbon dioxide equivalents, retaining the formula, coefficient source and calculation results.

  6. Support and Approval

    Each data can be attached with an electricity bill, invoice or meter reading record, and the verification, return and approval can be completed according to the set process.

  7. Statistical Analysis

    Use charts to grasp the proportion and changes of emissions in each category, location and month, and identify major emission hotspots.

  8. Inventory output and verification preparation

    Output the inventory inventory and statistical reports according to the inventory period and applicable standards, together with supporting evidence and audit records for verification.

Core functions

Filling deadline and grading reminder

Flexibly set the data filling deadline and hierarchical reminder objects, automatically notify personnel and managers who have not completed filling in the data, reduce manual collection and keep track of the progress of the inspection. > Picture location: below the description of this function; corresponding to the module operation screen on page 21 of the briefing.
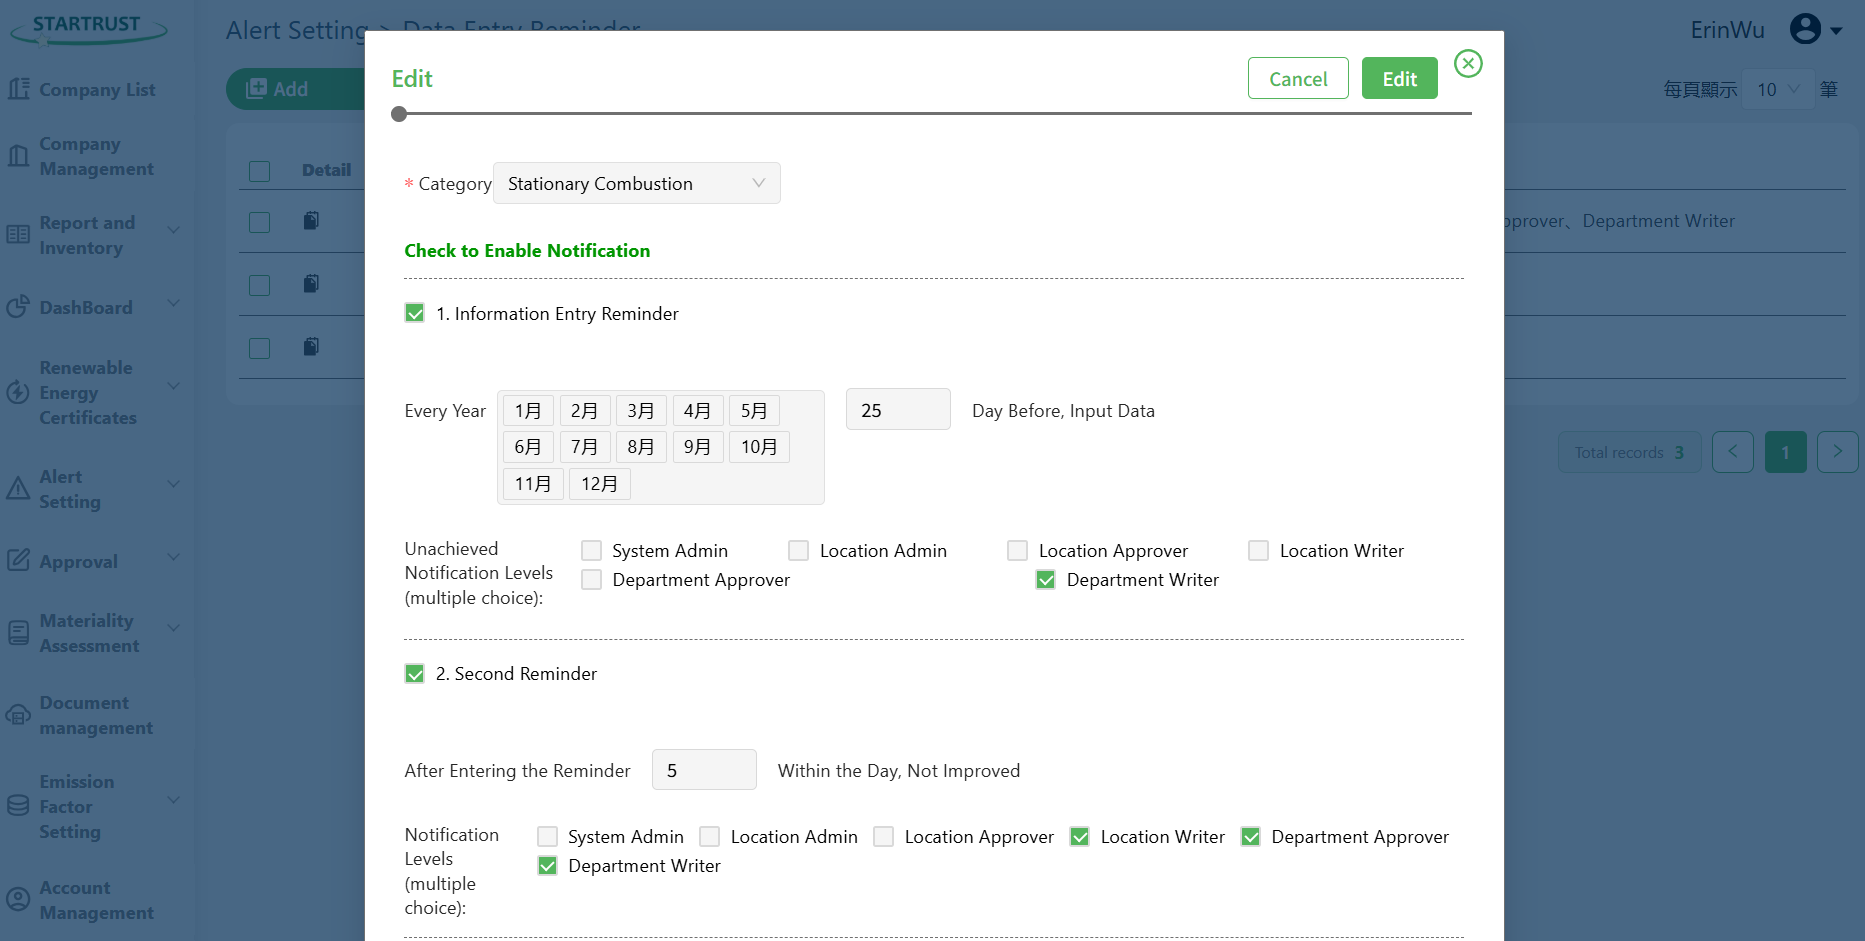
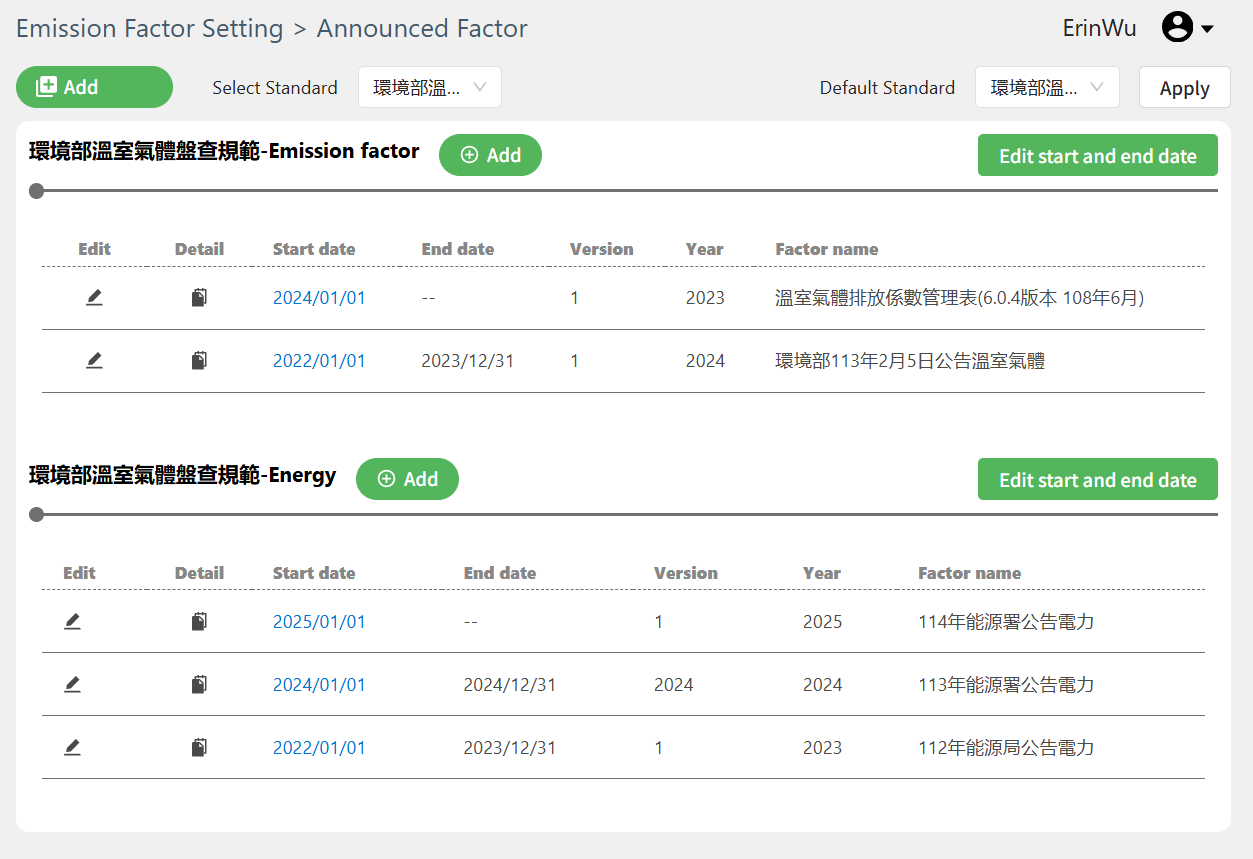
Reminder screen for filling in the organizational greenhouse gas inventory management module

Emission coefficient and version management

Centrally manage various emission coefficients, applicable years and version validity periods to ensure that the correct basis is applied in calculations so that emission results are accurate and traceable. > Picture location: below the description of this function; corresponding to the module operation screen on page 22 of the briefing.

Emission coefficient management screen of organizational greenhouse gas inventory management module

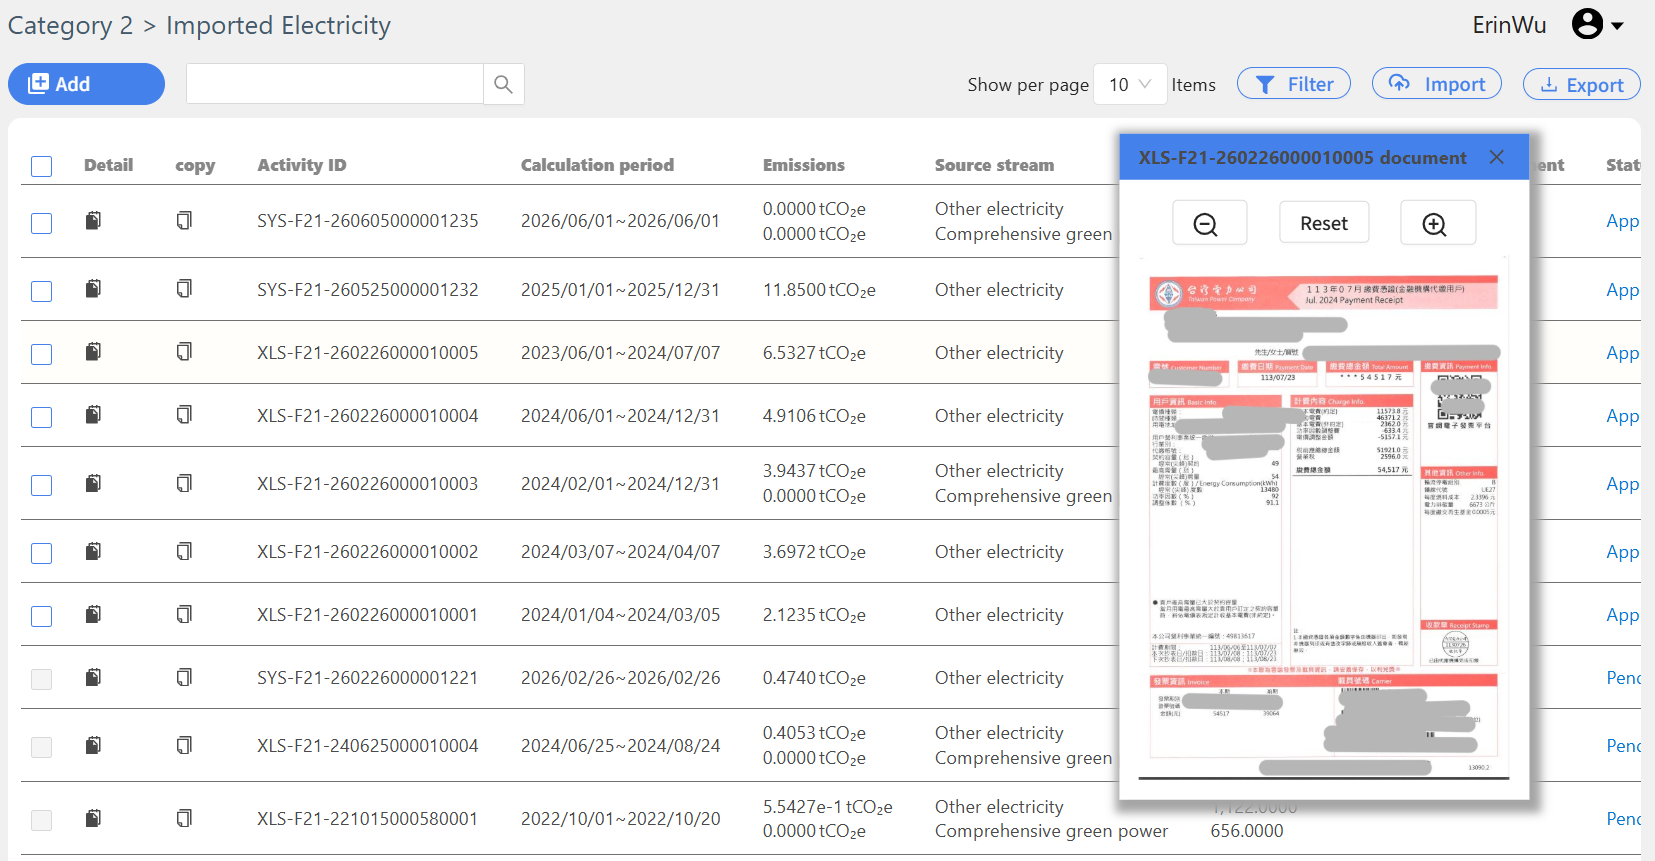
Supporting data management

Centrally manage electricity bills, invoices, meter reading records, equipment information and activity data to facilitate instant access and review by users, ensuring that every inquiry result is traceable with evidence. > Picture location: below the description of this function; corresponding to the module operation screen on page 23 of the briefing.

Supporting data management screen of organizational greenhouse gas inventory management module

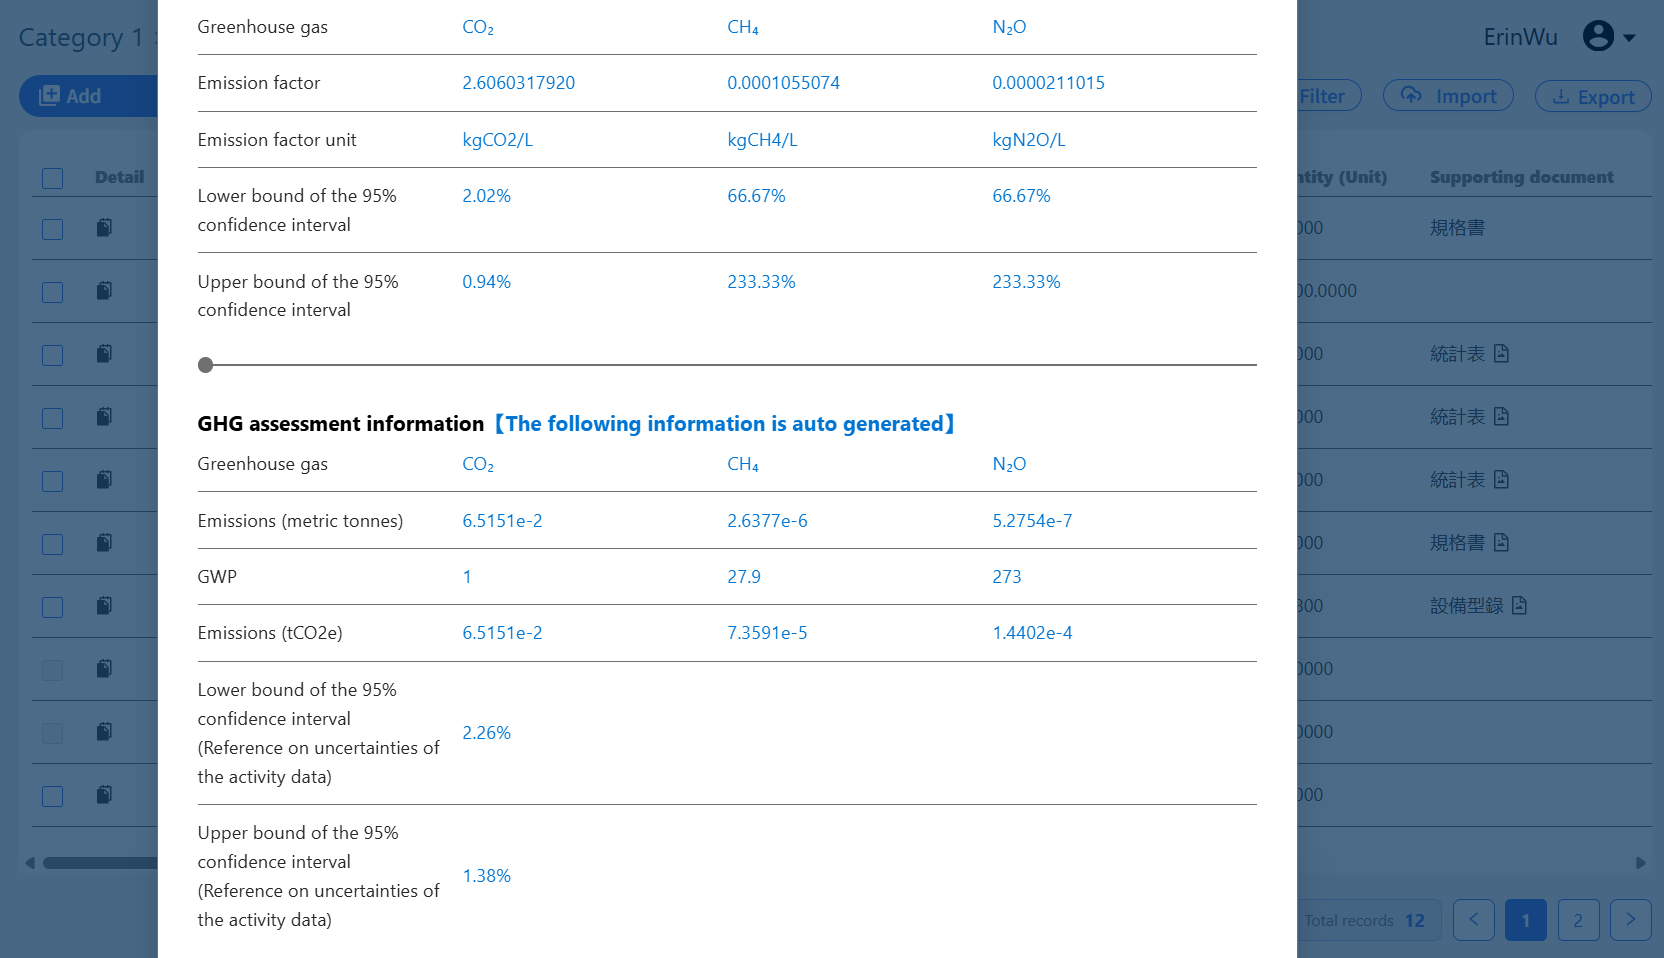
Built-in complete global emission coefficients

Built-in global emission coefficients and GWP data, coefficients can be quickly imported according to emission types, calculation intervals and applicable specifications, greenhouse gas emissions are calculated, and the calculation basis and results are fully presented. > Picture location: below the description of this function; corresponding to the module operation screen on page 24 of the briefing.

Emissions calculation screen of organizational greenhouse gas inventory management module

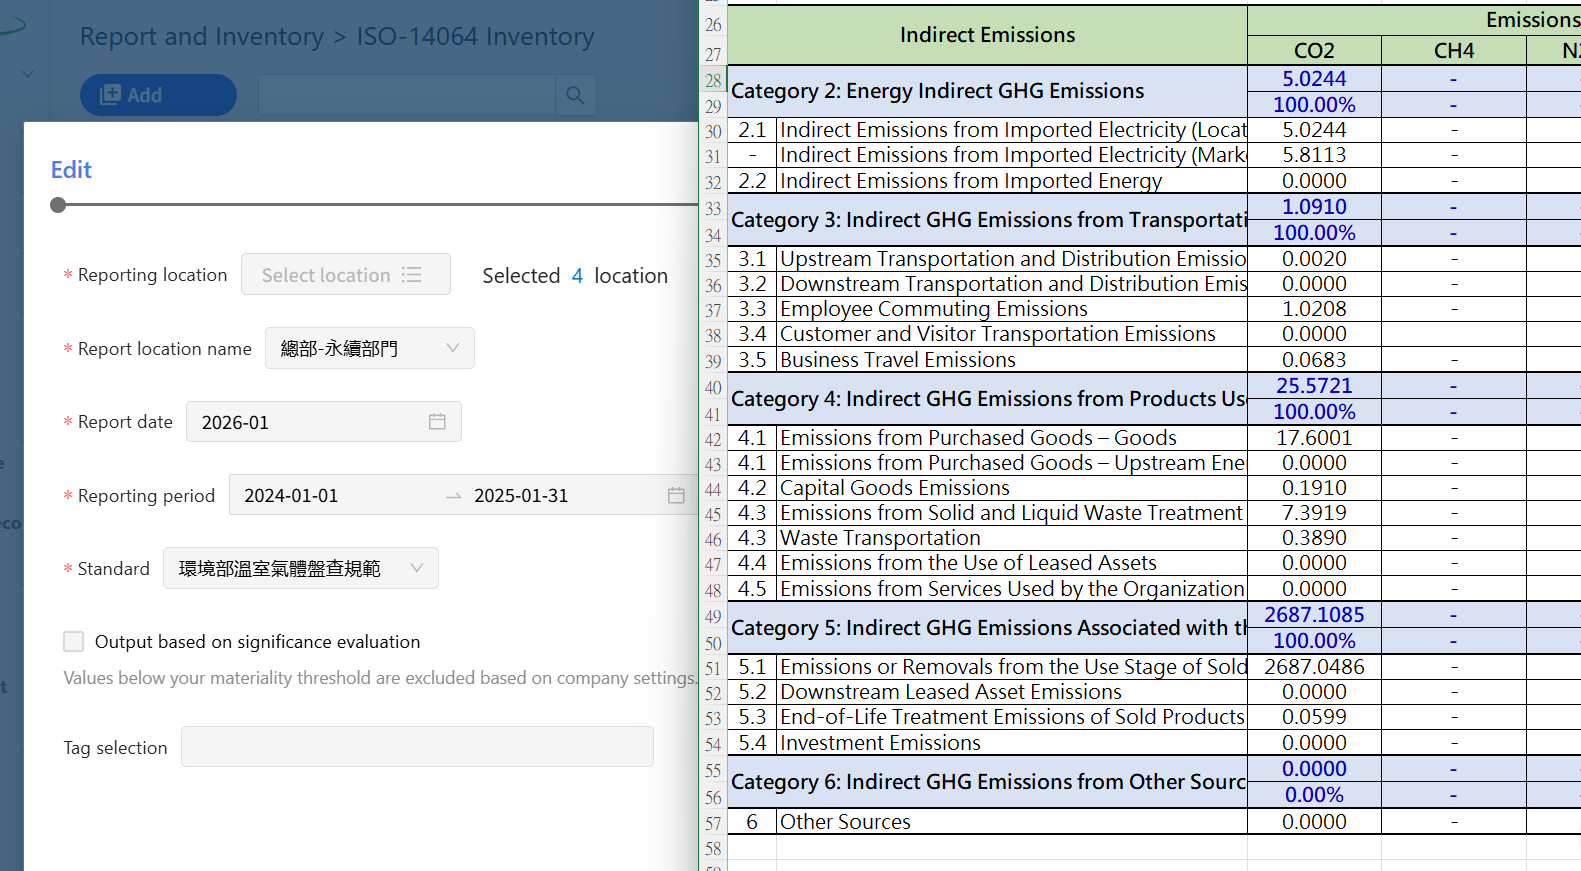
Inventory inventory and report output

According to the inventory points, statistical intervals and applicable standards, greenhouse gas inventory inventories and reports that meet the verification needs can be generated with one click. > Picture location: below the description of this function; corresponding to the module operation screen on page 25 of the briefing.

Inventory inventory output screen of organizational greenhouse gas inventory management module

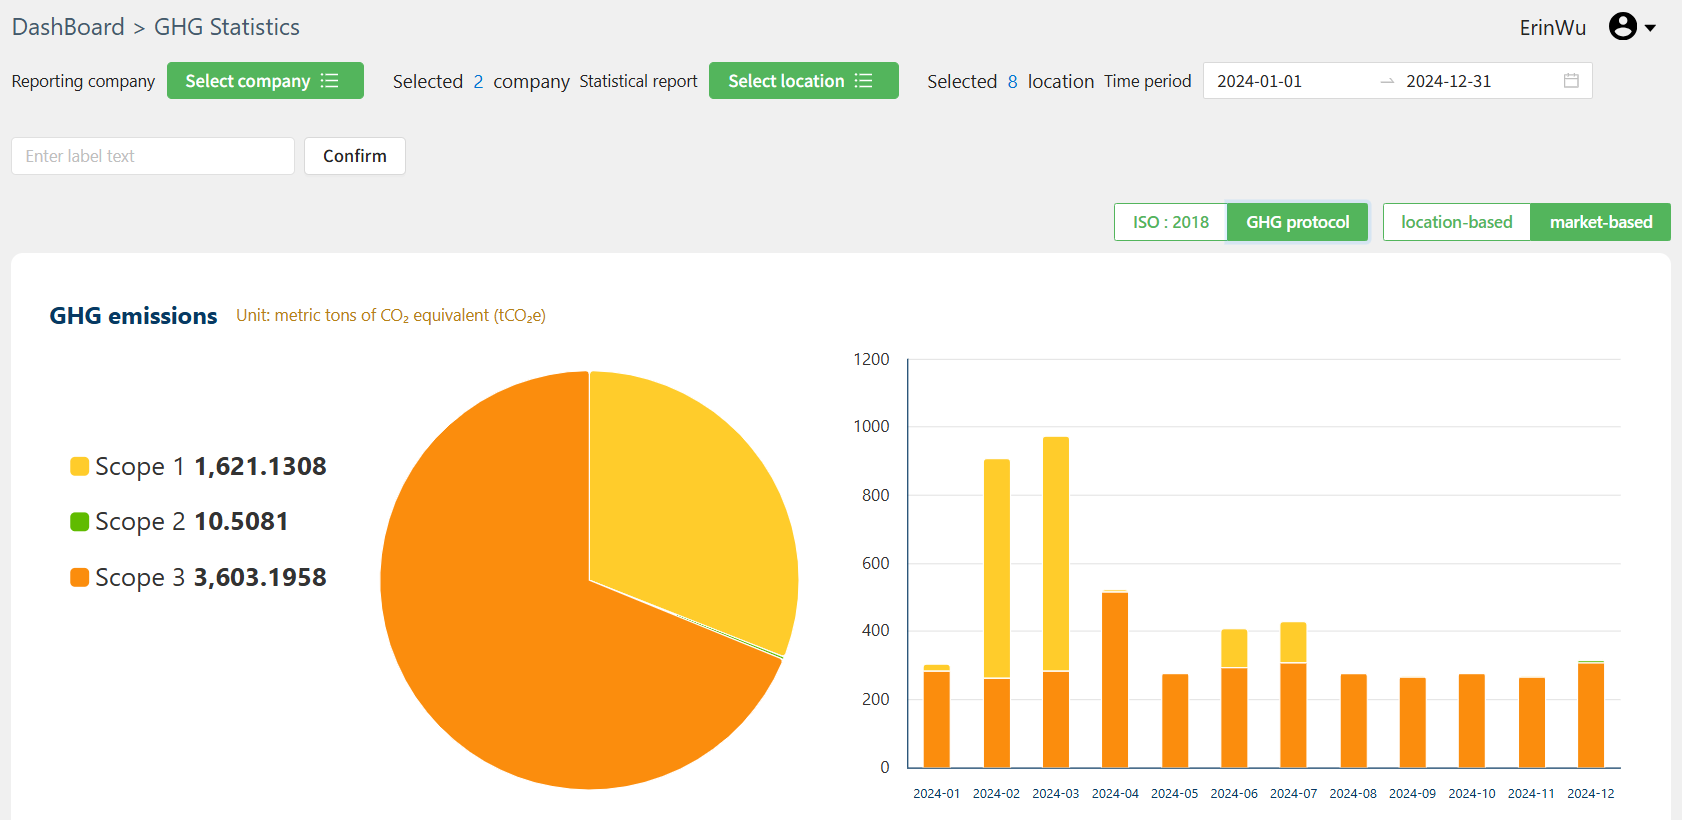
Visual analysis of emission data

Charts are used to present the emission proportion and monthly changes in each field, and carbon emission trends can be analyzed according to companies, locations, periods and inventory standards. > Picture location: below the description of this function; corresponding to the module operation screen on page 26 of the briefing.

Emission data analysis screen of organizational greenhouse gas inventory management module

What changes can be brought about after importing?

Data collection: from urging items one by one to monitoring progress in real time

The module sends out filling and overdue reminders according to the division of labor, and displays the completion status of each location in a centralized manner. The organizer no longer has to track them one by one through emails, messages and multiple forms.

Collaborative management: From multiple Excels to a single platform for operations

Everyone can fill in and review reports on the same platform according to their authority, and the modification record and processing status can be clearly checked, reducing the risk of version confusion, formula modification, and data overwriting.

Built-in data and coefficient module, you can quickly log in and import coefficients

The module has built-in activity data and global emission coefficient data. You can quickly log in and import data, and bring in applicable coefficients according to emission types and calculation intervals, reducing the risk of manual search, application errors and double calculations.

Data quality: from finding errors afterward to checking in real time during the filling process

Each activity data can be linked to the emission source, calculation basis, supporting documents and audit status, allowing the team to confirm deficiencies or anomalies one by one during the reporting and auditing process.

Preparation for verification: from temporary search for documents to continuous accumulation of data

Supporting documents can be saved along with the data, and inventory inventories and statistical reports can be output to shorten the preparation time for internal audits and external verifications.

Management decision-making: from knowing the results only after the aggregation is completed to immediately understanding the emission hot spots

Managers can check emission proportions and trends by company, site, category and month, and identify main emission sources in advance as a basis for subsequent carbon reduction management.

Turn sustainability goals into the next actionable step

Talk to us